Participation Rates and Harm Estimates Measure Different Things
Introduction
Gambling surveys often present two figures side by side: the proportion of people who gambled and the proportion experiencing gambling-related harm. They may seem like competing measures of the same behaviour, but they answer different questions. One measures how widespread gambling is; the other measures its consequences. Each also depends on its own question, denominator and method.
This distinction matters when surveys are used to describe change. A rise in participation does not, by itself, show that harm has increased. Nor does a fall in participation prove that fewer people face serious consequences. Treating the measures as interchangeable can lead to headlines that claim more than the evidence supports.
Populations and measures
Participation is usually measured as the share of a defined population that reports gambling within a set period, such as the past year or month. This shows how common the activity was in that group and timeframe. It does not show how often people gambled or how much they spent.
Harm estimates can refer to different populations. A survey might report the share of all respondents who meet a screening threshold, or the share of gamblers who report harm. These figures answer different questions: the first estimates the burden across the population, while the second describes harm among participants.
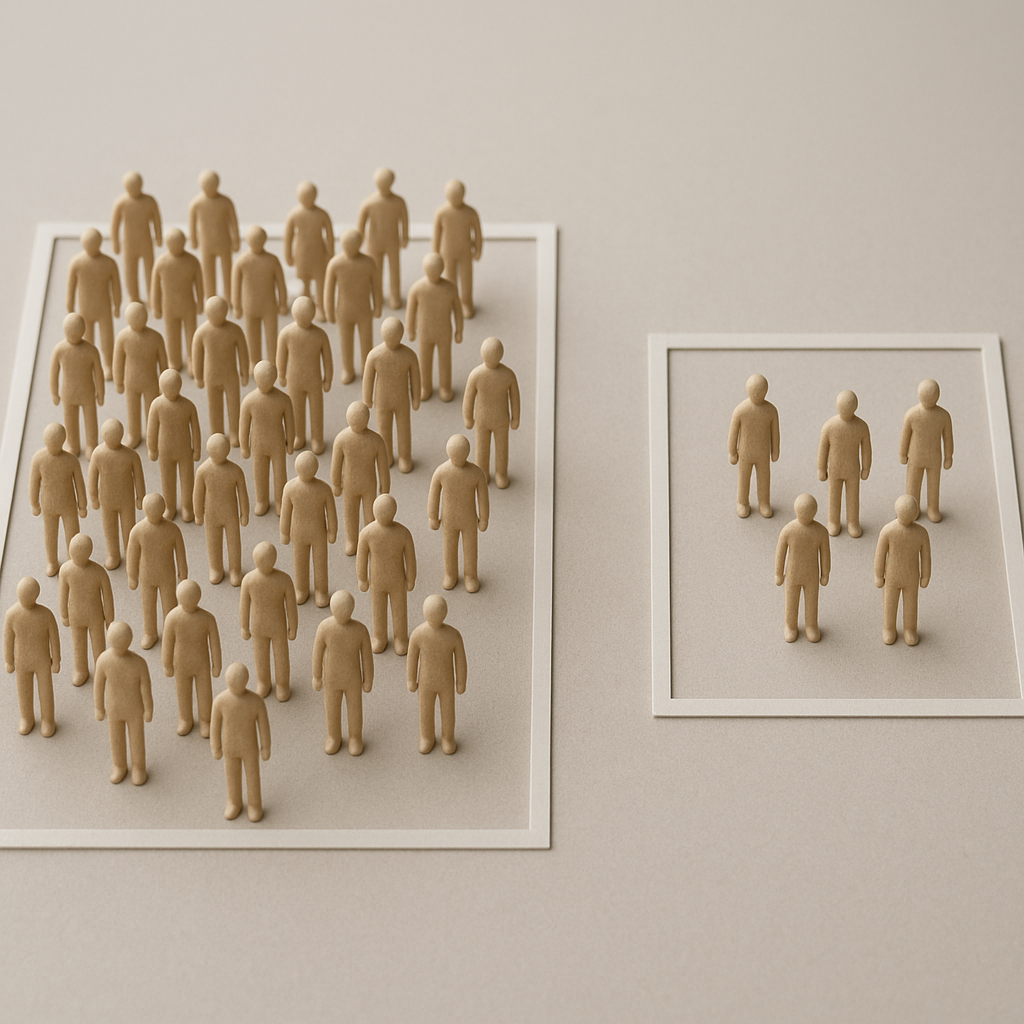
The denominator can change the story even when the underlying responses stay the same. For example, a small share of all adults might report harm, while a larger share of gamblers falls into a harm category. Both figures can be valid: one describes the whole population, the other only those who gambled. Comparing either with a participation rate without specifying the denominator can be misleading.
The term “harm” also covers different things. Some surveys use screening tools that group people based on answers about impaired control, financial pressure, relationships or other consequences. A screening category is an estimate based on a specific tool. It is not necessarily a clinical diagnosis, a count of everyone affected or a measure of society’s total financial costs.
Key factors
Start by checking the timeframe. Participation measured over twelve months cannot be compared directly with harm measured over a shorter period, or with a question about whether someone has ever experienced consequences. The recall period affects what respondents remember and what the figure represents.
Survey wording also affects participation estimates. A broad question about gambling may include occasional, low-stakes activity as well as regular play. Naming specific products or settings can prompt different responses. If the list of activities changes between survey waves, an apparent trend may reflect a change in measurement rather than behaviour.
Harm estimates depend on further methodological choices, including the screening threshold, the questions asked and how responses are scored. Even a small change to the tool can affect who falls above the threshold. Comparisons over time therefore require a consistent measure or a clear account of how results were made comparable.
Sampling and response patterns affect both measures. Survey respondents may differ from those who do not take part, and some groups may be harder to reach or less likely to disclose sensitive behaviour. Weighting can bring a sample closer to the target population, but it cannot remove every source of bias. It is also important to consider the uncertainty around an estimate, especially when the change is small.
Participation and harm are not linked in a simple, one-to-one way. Occasional gambling may be widespread while harm is concentrated in a smaller group. A smaller group of participants may also include substantial harm. Neither rate alone shows how harm is distributed, how severe it is or who is most affected.
Scenario: when the figures appear to disagree
Imagine a series of surveys in which participation rises while the share of all respondents identified as experiencing harm remains broadly stable. This does not prove that expanded participation has no consequences. The measure may not capture changes in severity, the survey may not be able to detect a small shift, or the additional participants may mostly gamble infrequently.
Now consider the reverse: participation falls, but the estimated rate of harm among gamblers rises. This could mean that problems are more concentrated in a smaller group. It could also reflect changes in who responded, how harm was measured or how the denominator was defined. The figures raise questions, but do not explain the pattern on their own.
To interpret the results, put both measures in context: identify the population, state the reference period, define the harm threshold and specify whether the harm estimate uses all respondents or only gamblers as its denominator. Then examine subgroup results, uncertainty and consistency across survey waves. If the method changed, say so rather than presenting the results as a straightforward trend.
Even then, a survey is a snapshot—or a series of snapshots—not necessarily a causal explanation. It can show that participation and reported harm changed in the same or opposite directions. On its own, it cannot establish that one caused the other or explain the roles of availability, product design, personal circumstances or support services.
Conclusion
Participation rates and harm estimates belong in the same discussion, but they are not competing versions of one statistic. Participation shows how many people report gambling within a defined period. Harm estimates describe a measured burden, shaped by the tool, threshold and denominator used.
Good reporting keeps these distinctions clear. It states who is counted, when behaviour was measured and what qualifies as harm. It also acknowledges uncertainty and avoids treating an association in survey data as proof of cause. This does not weaken the findings; it clarifies what the evidence supports and where interpretation begins.